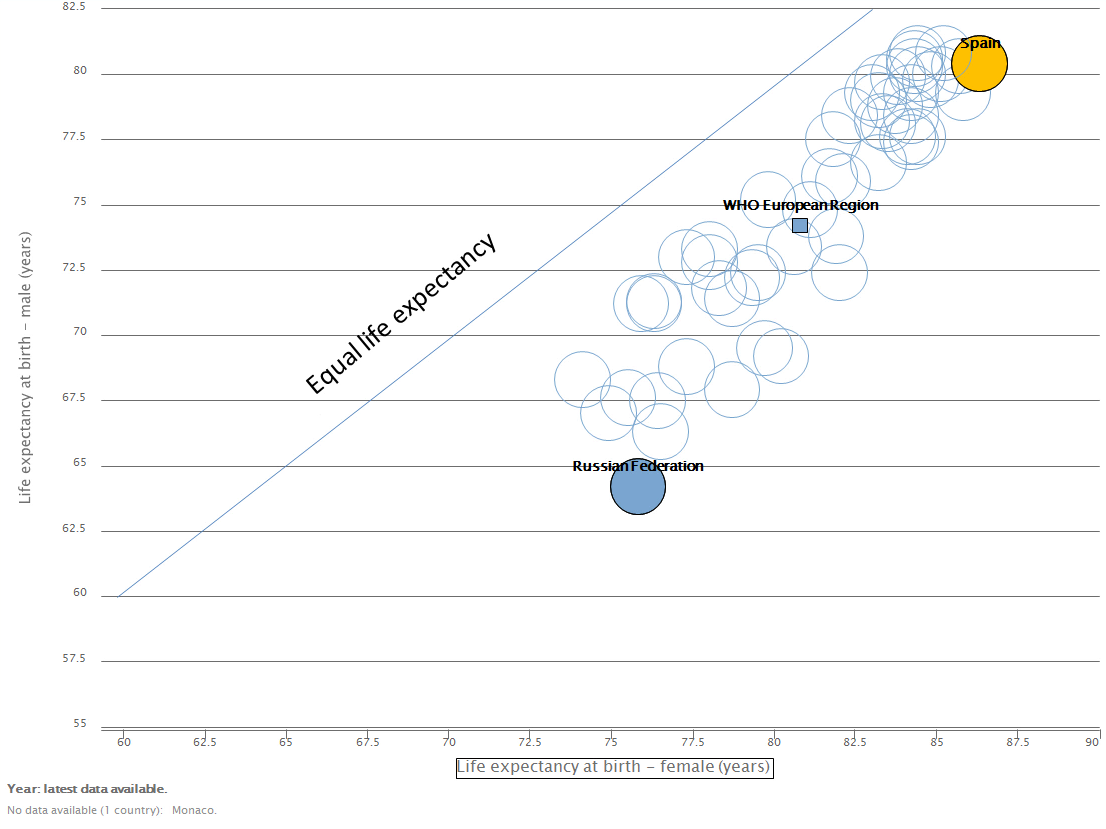
See the video below on how to export a graph from the HFA explorer and edit it in PowerPoint. Note: Russian subtitles are available for the video.
1. Open the HFA explorer https://gateway.euro.who.in/hfa-explorer/
2. Create a bubble chart.
3. Select two different indicators for x-axis and y-axis.
4. Select Show latest data available.
5. To highlight data points on the chart, click on them and chose Select.
6. Download the graph in WMF vector format using default settings.
7. Insert the exported chart as a Picture in PowerPoint.
8. Convert the chart to a Microsoft Office drawing object, by clicking in the chart area, choose Group and then Ungroup. Press Yes when a dialog box appears.
9. To remove the outline from the text, select the text and set Shape Outline to No Outline. Shape Outline is found in the Drawing group on the Home ribbon.

10. To change the colour of one the bubbles, select the bubble, go to the Format ribbon, and in the Drawing tile, click on Shape Outline and select Shape Fill to choose a colour.

11. To draw lines and other objects, in the Home or Format ribbons, select the shape and place it on the chart.

12. The final chart can look like this:
