 This tutorial shows how to download an indicator’s data from the WHO/Europe Data Warehouse API, by using the jsonlite package in R. Another tutorial - How to download WHO/Europe DW metadata using API - shows how to download metadata using jsonlite into R. We will build on that tutorial’s information, so please see that tutorial before viewing this one.
See the below video for more information. Note: Russian subtitles are available for the video.
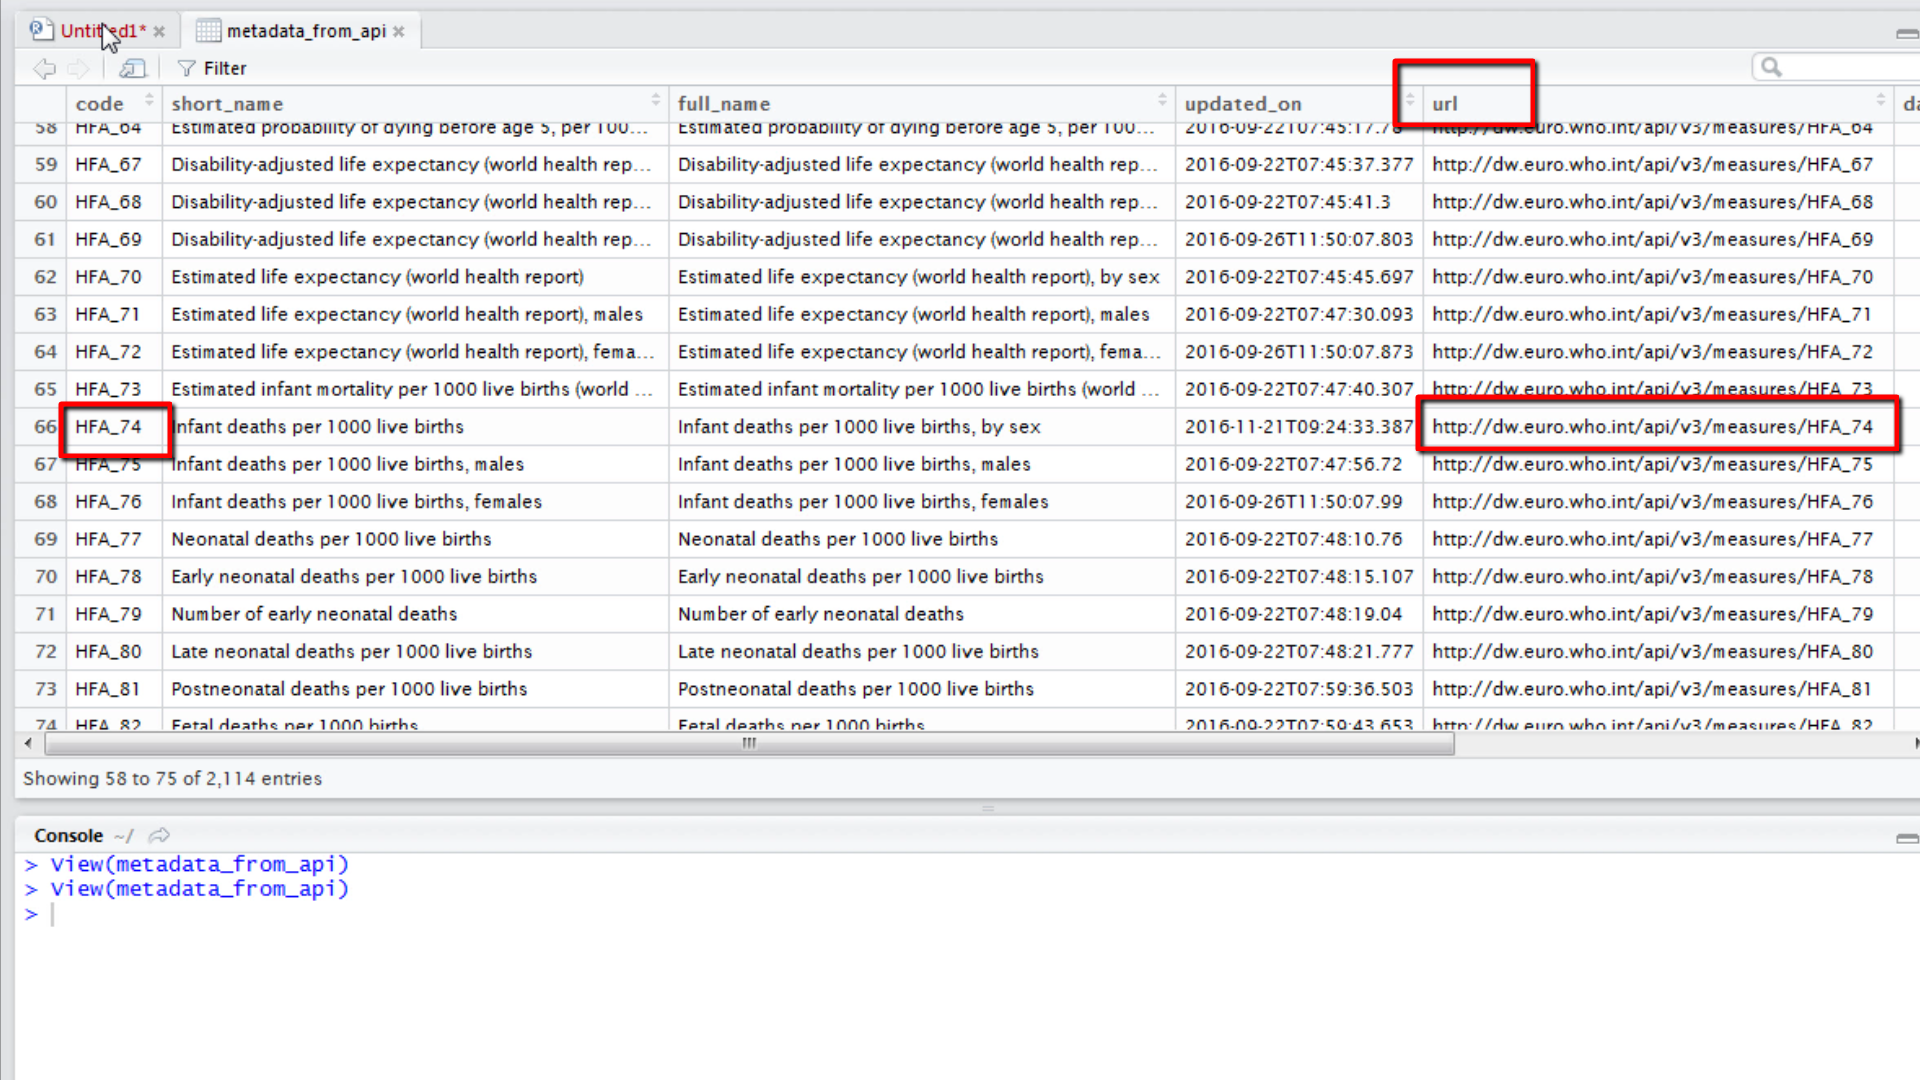
1. To download an indicator’s data it is necessary to call the Data Warehouse API URL of the indicator. First find the URL in the metadata. Open the metadata. The indicator’s URL is displayed in “url” column of metadata. Let’s assume we want to download data for the indicator with the identifier HFA_74. Scroll down to the row listing the indicator HFA_74 and retrieve the information in the “url” column.

2. Create a variable called “url” by typing the code and then run the code.
url=”http:/dw.euro.who.int/api/v3/measures/HFA_74”
3. If you need to find out more information about the methods in the WHO/Europe API, see the documentation at API Specifications.
4. Data will be extracted using functions readLines and fromJSON of jsonlite package. Use this code and run it.
rd <- readLines(url, encoding=”UTF-8”, warn=F)
data_from_api <- fromJSON(rd,simplifyDataFrame = TRUE)
data_from_api <- data_from_api[[“data”]]
5. This created a data frame called “data_from_api” which contains all data of the indicator HFA_74. The data frame contains the indicator’s attributes, dimensions and values for each piece of data. You can use this data frame to perform statistical analysis or to draw basic graphs.
6. In other tutorials we show how to draw basic graphs using the indicator’s data.